
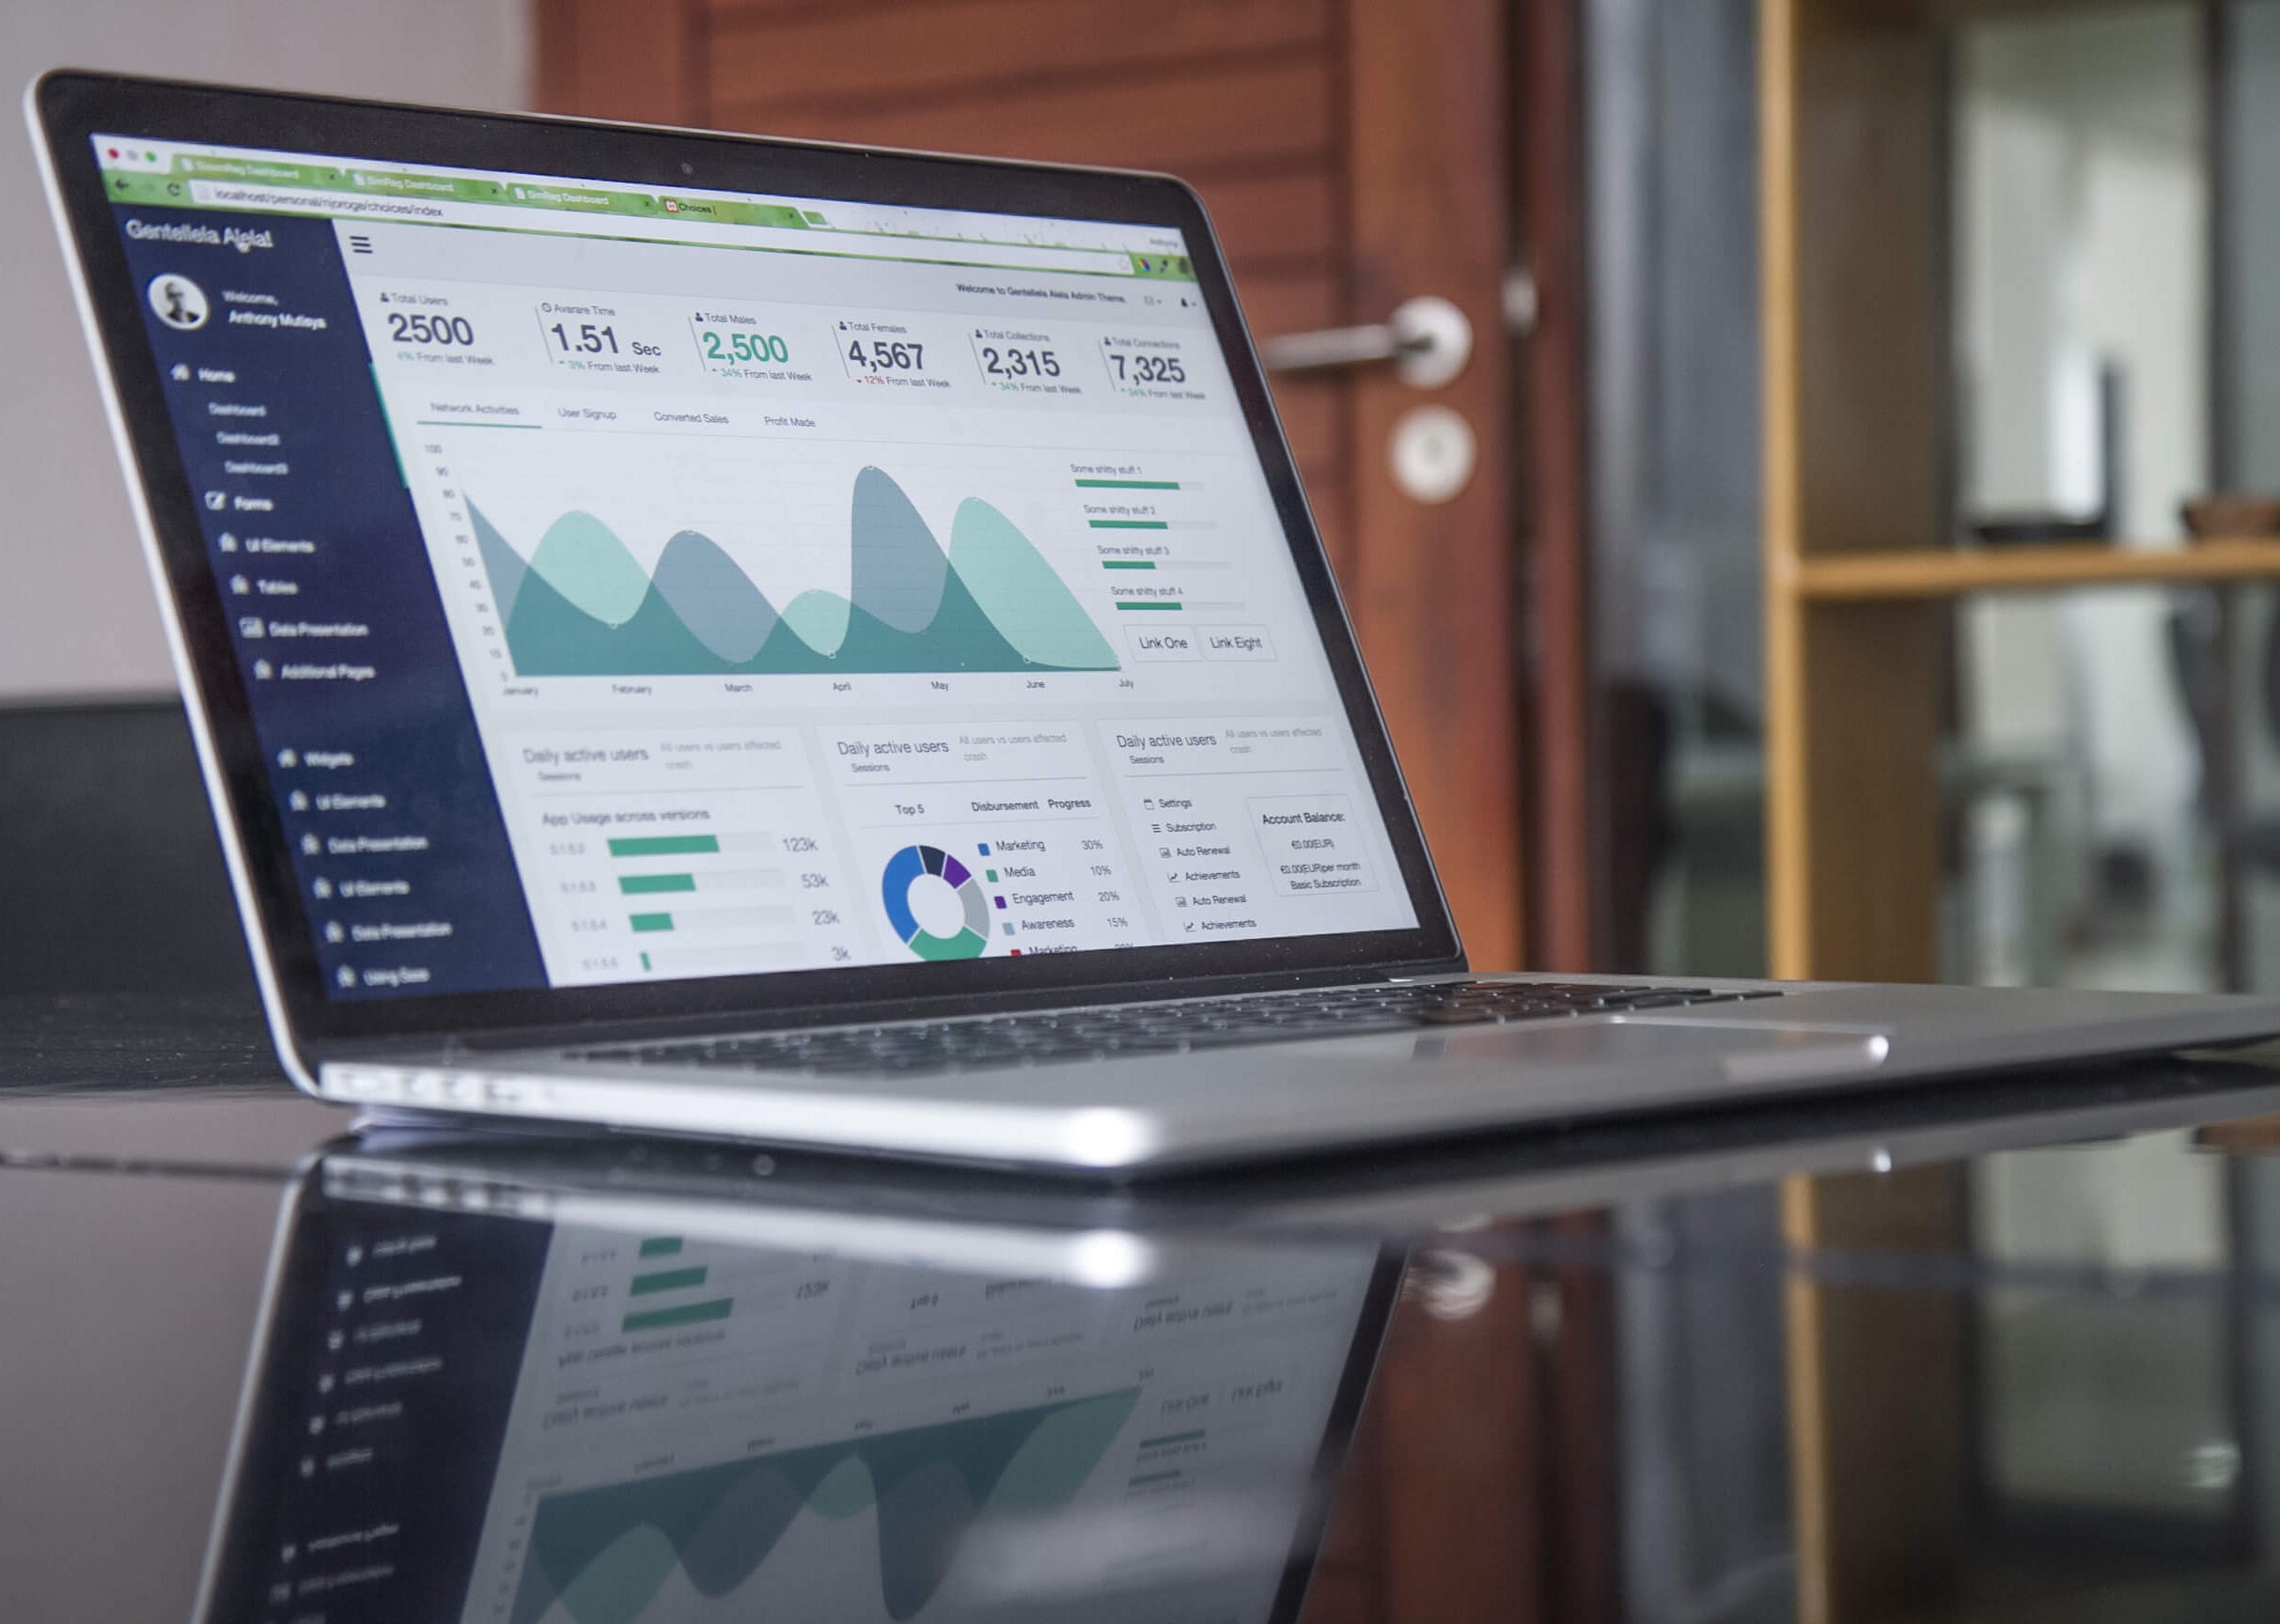
This function delivers the data produced across the whole software: operating reports, printable documents, summary dashboards and logged time tracking. Above all, it includes two designers, one for reports and one for dashboards, which let your own teams build their own outputs.
That is what separates a living solution from a tool that’s frozen the day it’s signed off.
Why industrial reporting so often ends up in Excel
The data already exists in the PLC, the MES, the weighbridge, the ERP, the laboratory or the quality database. And yet every Monday morning, someone exports, copies, pastes, corrects, formats and sends the file. The problem isn’t Excel: the problem is that producing the report has itself become a manual process. PILOT automates that chain so your teams spend their time analysing results instead of manufacturing figures.
How it works
Data available across PILOT and its various functions is drawn from a single environment.
The user picks the data, periods, filters and levels of analysis needed.
Reports and dashboards are built using the built-in designers.
Indicators draw on the data and reference sets already held in PILOT.
Results are presented as tables, charts, KPIs or operating documents.
An output built once can be run again for a new period without rebuilding the report.
Three real-world situations solved by this function
The daily report takes an hour to prepare
The situation: Data is exported from several tools, then assembled by hand.
With PILOT:
- Relevant data centralised
- A report template reused
- Indicators calculated
- Consistent output every time
The benefit: The report gets used, not rebuilt.
Every site presents its KPIs differently
The situation: The same indicator rests on different files, definitions or calculation methods.
With PILOT:
- A reference set shared with every other PILOT function
- Common definitions
- Filters and periods kept consistent
The benefit: Cross-site comparisons become meaningful.


Every new dashboard turns into an IT request
The situation: The business wants a new view, but it depends on a software change.
With PILOT:
- Report designer
- Dashboard designer
- Output configured directly by authorised users
The benefit: Once trained, your teams gain real independence over their own outputs.
Reporting and dashboard functions
An output is only as good as the data behind it
A dashboard built on figures typed in at the end of a shift stays a dashboard of figures typed in at the end of a shift. The quality of the output depends entirely on how the data was captured upstream.
That is why this function relies on the same data model as the others, and on data captured at source rather than declared.
Reporting, Business Intelligence or Excel: who does what?
| Tool | Main use |
|---|---|
| Excel | One-off analysis, ad hoc calculation, individual work |
| PILOT reporting | Recurring industrial output, directly tied to operations |
| Corporate BI | Cross-business consolidation for decision-making at scale |
PILOT is not meant to systematically replace a corporate BI platform. Its value is to provide a reporting layer directly connected to industrial operations and their shop floor data.
Where this function delivers the most
Factories, logistics platforms, warehouses, port terminals, sorting and waste facilities: what determines the fit is the structure of the flow and the number of stations, not the industry.
Case studies

The other functions
Industrial reporting shares its data model with the other functions. Each one runs independently, on the same foundation.