
This function detects stoppages from the signals sent back by your equipment, then lets you classify them against a structured reference set: stoppage type, sub-type, cause family and precise cause. The goal is not to log more stoppages, it is to log them the same way from one shift to the next.
That consistency is what makes loss classification mean something, and what makes the performance indicators calculated elsewhere reliable.
Why downtime alone doesn’t tell you anything
A line can show four hours of downtime for the week. That figure explains nothing on its own: a breakdown, a material shortage, a changeover, cleaning, an operator waiting, or a planned stoppage could all produce the same number. When every team uses its own wording, the statistics exist but cannot support a decision. A shared reference set turns a duration counter into information you can actually act on.
How it works
Equipment status is picked up from PLCs, SCADA or other available sources.
PILOT determines the start, end and duration of each stoppage.
The operator or supervisor links the event to the matching cause.
Causes are organised by family, type and sub-type, so the same vocabulary is used everywhere.
Durations, frequencies and causes are analysed by period, equipment, line or workshop.
Recurring losses become visible and can be prioritised in action plans.
Three real-world situations solved by this function
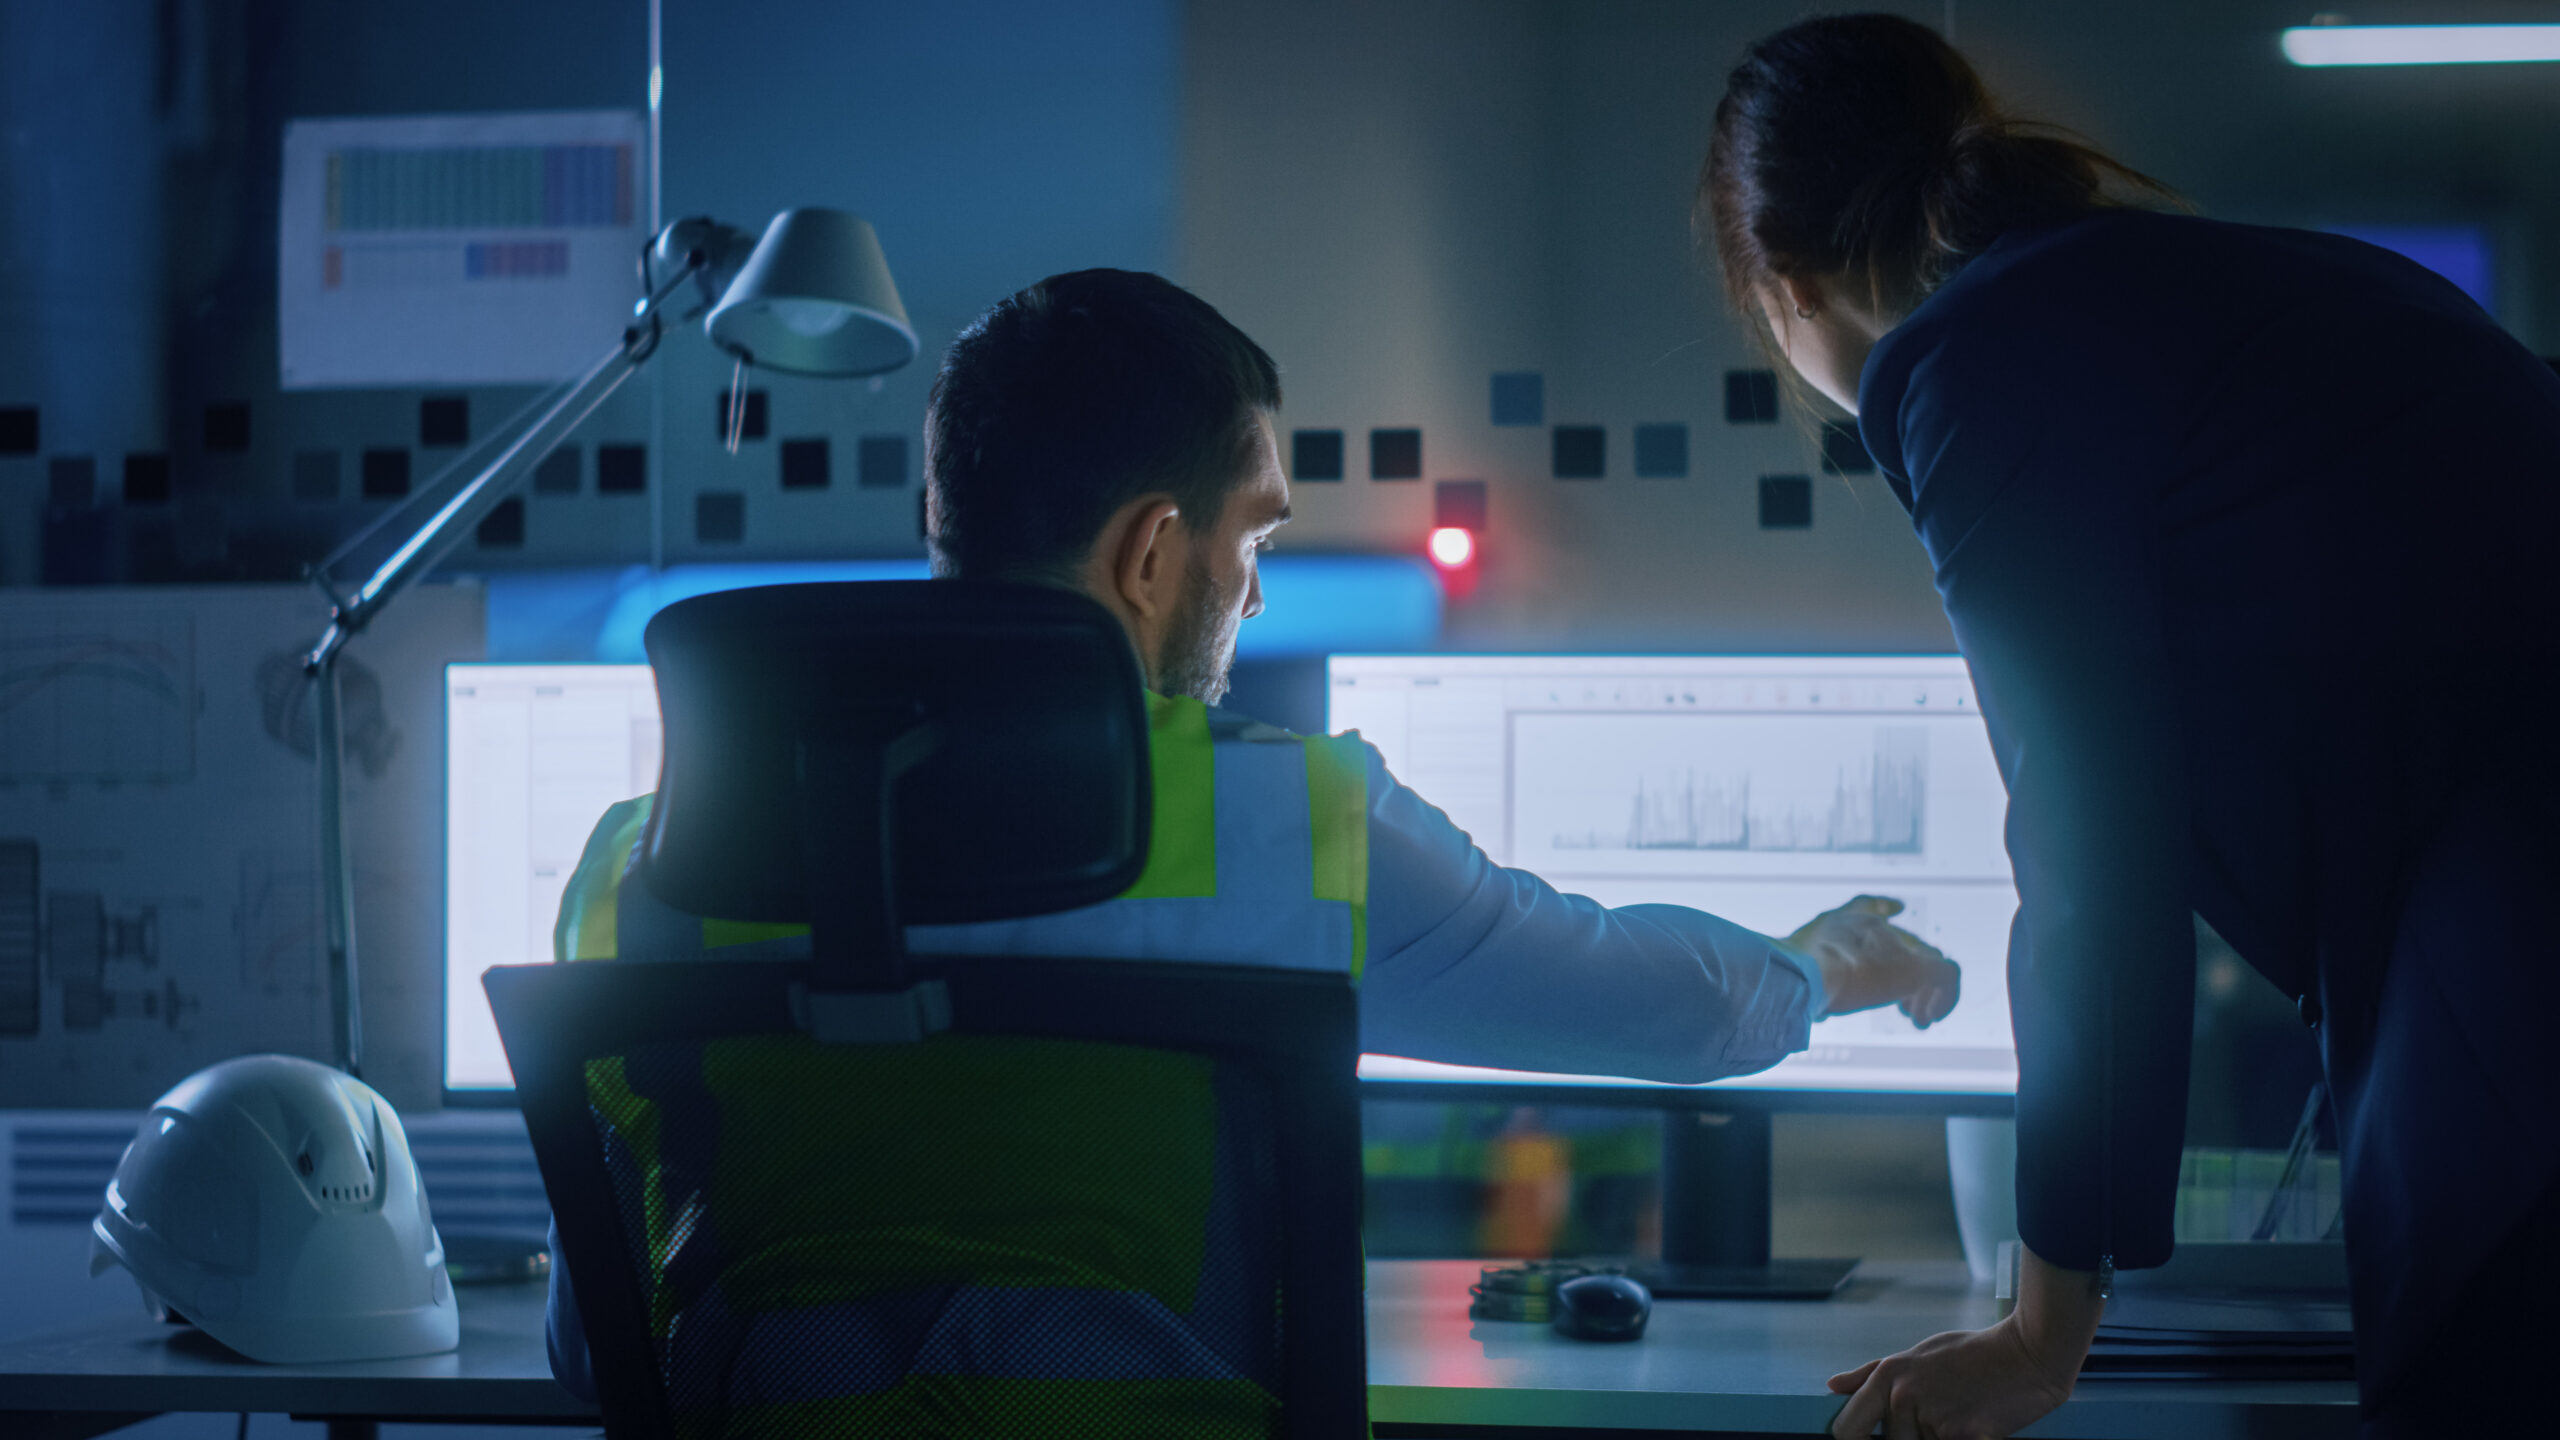
We know how long the line stops, but not why
The situation: SCADA gives you stoppage times, but no usable cause is attached to them.
With PILOT:
- Stoppage periods detected
- Classified against a structured reference set
- Full event history
- Analysis by equipment and by cause
The benefit: Lost time becomes operational data, not just a counter.
Every team uses its own causes
The situation: Maintenance talks about a conveyor fault, production about a line block, and the operator about a feed problem.
With PILOT:
- A shared reference set of causes
- Consistent families, types and sub-types
- The same classification structure across equipment and workshops
The benefit: Analysis becomes comparable across teams, periods and sites.


We deal with the most visible stoppages, not necessarily the most costly
The situation: A two-hour breakdown sticks in people’s minds. Twenty five-minute micro-stoppages can cost more.
With PILOT:
- Ranked by duration
- Ranked by frequency
- Consolidated by cause family
- Trends tracked over time
The benefit: Action goes where the losses are actually significant.
Downtime tracking functions
Stoppage, alarm and breakdown: what’s the difference?
| Term | What it describes |
|---|---|
| Alarm | An event or state flagged by a system |
| Stoppage | A period during which the equipment or line isn’t producing |
| Root cause | The operational reason behind the stoppage |
| Breakdown | One of several possible causes of a stoppage |
A stoppage is not necessarily a breakdown. That is exactly why a plain alarm list is not enough to analyse production losses.
Where this function delivers the most
Factories, logistics platforms, warehouses, port terminals, sorting and waste facilities: what determines the fit is the structure of the flow and the number of stations, not the industry.
Case studies
One solution, several functions
Our PILOT solution also covers access, weighing, production, the laboratory, truck flows and integration with your business system, all on a shared site data model.
You only turn on what you need, and you extend when the need arises, without changing tools or rebuilding interfaces.
The other functions
Downtime and causes shares its data model with the other functions. Each one runs independently, on the same foundation.
Your questions answered